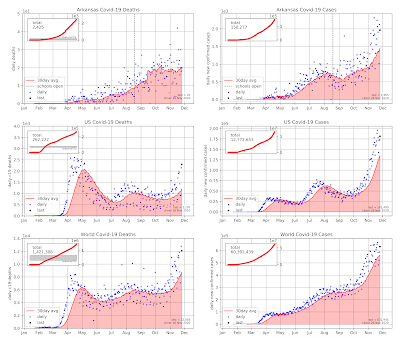
Something a bit different today. Rather than the usual 7-day average on the dot plots I now have applied a 30-day average. This allows the reader to quickly judge if C19 things are getting better or worse from one month to the next. For example, November is on track to be the worst month for daily case increase for AR, US and World.
My plan is to continue posting daily 7-day average plots and add a 30-day plot at the beginning of each month.


