
For example Sandridge Energy put out this map:
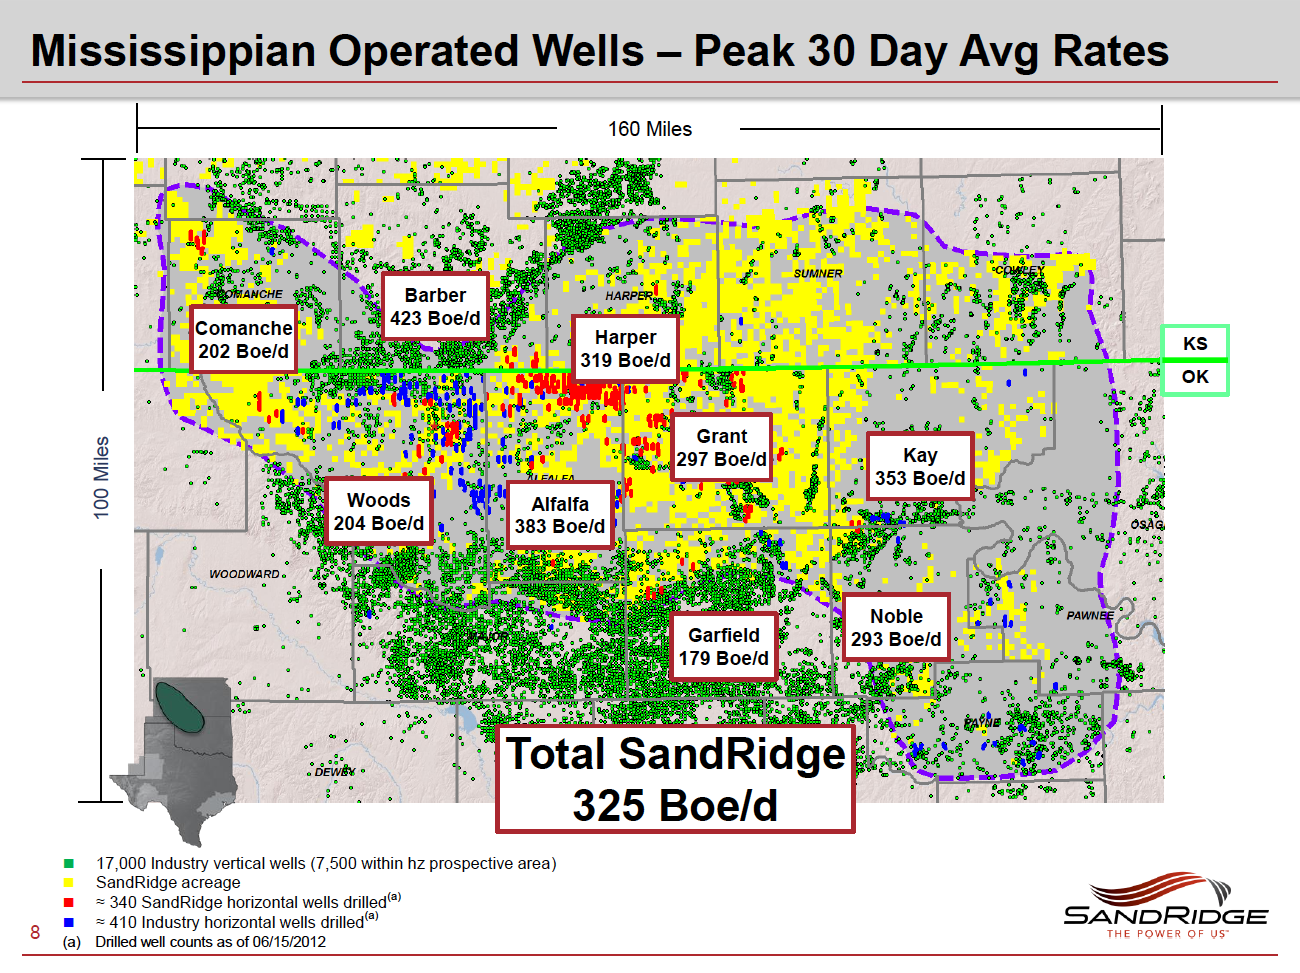
Of interest here is the Mississippian (Miss) discovery on the Oklahoma-Kansas border. The Miss in this part of the country is a thick carbonate unit topped by a regional unconformity and overlain by Pennsylvanian (Penn) age clastic sediments (sandstone and shale). The Miss production can come from secondary porosity near the unconformity, or deeper zones in the Miss related to chert development and/or fracture trends. Either way, a good image of the upper Miss is critical to this exploration play, especially since horizontal well technology is being used.
Farther north in Kansas is our Dickman project area. We have been working for several years imaging and characterizing the Penn and Miss section this site. This will be of interest to the industry as the horizontal oil revolution accelerates in the next few years.
As one example, consider a map of the Dickman project (Figure 2) showing well control and an arbitrary seismic line (red).

The amplitude data along this line (Figure 3) shows two wells and the Miss pick in each. One could map the approximate unconformity surface with this data, but there is little enlightenment as to the detailed structure and stratigraphy at this critical boundary.

Now have a look at Spice attribute data along this same line (Figure 4). This was computed using my research code. The unconformity surface is now starkly visible, along with with clear, crisp detail on geological features deeper into the Miss. Using the Spice data, a precise Miss map can be constructed along with discontinuity maps in the upper Miss. These may represent small faults, fracture trends, or karst features. In any case, they would be of interest in planning expensive horizontal wells.

Spice has many parameters that can be tuned for specific purposes. Here is another example tuned for maximum time resolution. This gives a kind of atomic decomposition of the subsurface intro primitive layer elements that indicate stratigraphic relationships. The unconformity at 1.445 s (on the left side) is very difficult to see on the seismic data, but clear and detailed on Spice. This has obvious application to horizontal well planning.

Figure 5. Seismic line from 3D data set and corresponding Spice attribute section. Note time lines are only 10ms apart in this detail view.
With my move to the University of Arkansas, I am interested in working with industry partners to apply and further develop this technology. If you would like to get a better view of your Mississippian horizontal drilling target, contact me at chris.liner@gmail.com.